Top Three Team Projects
Among the many great projects, below are descriptions of the top three projects (in alphabetical order) that were developed for this course. They are all worth checking out. Great work!
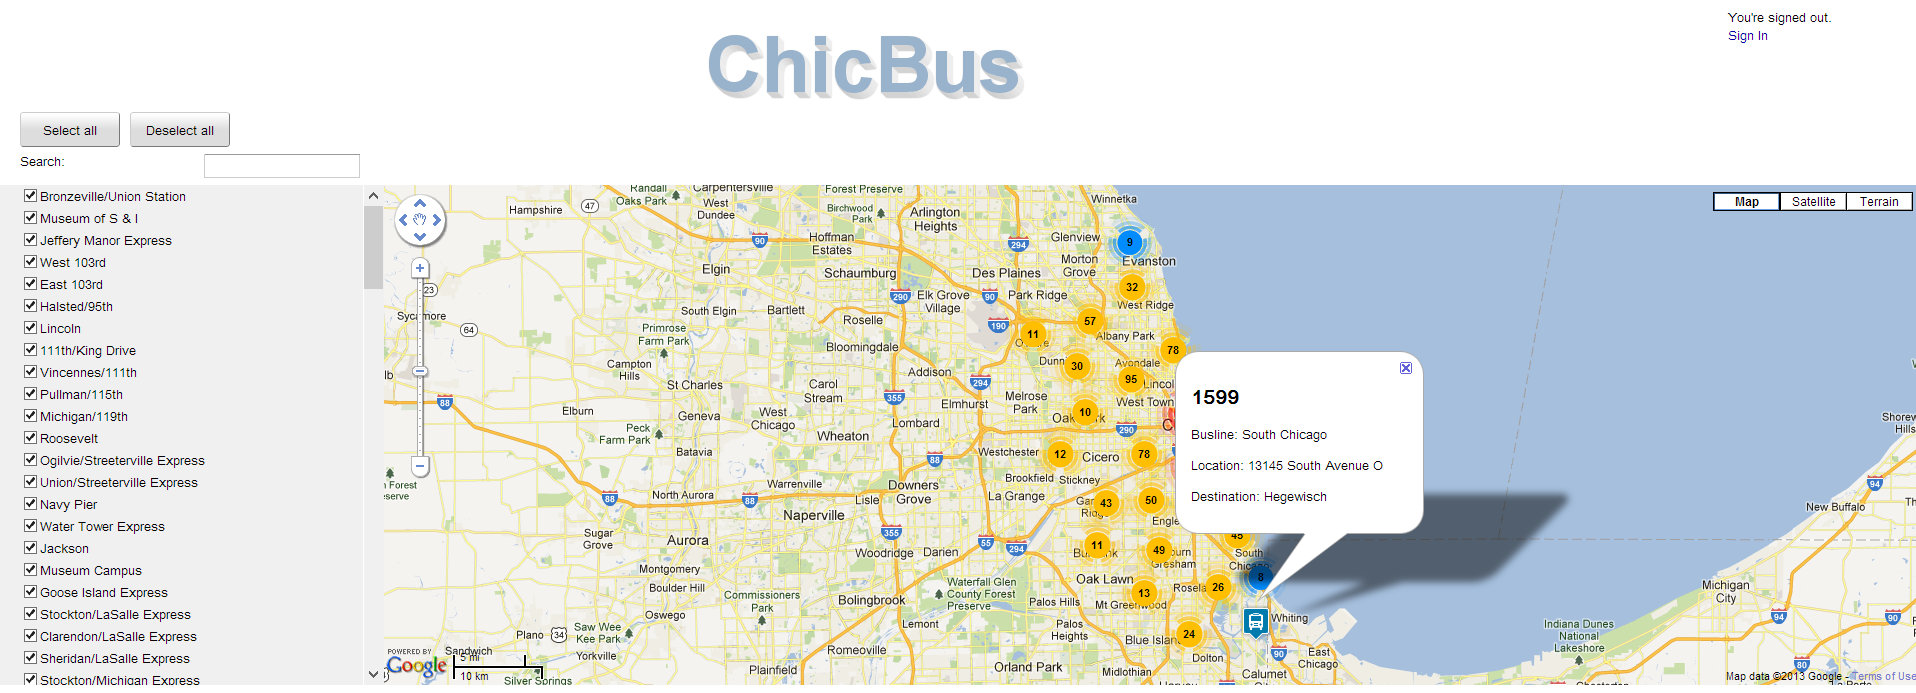
ChicBus
| Team | Mark Bosshard, Benedikt Buenz and Ivo Jenni |
| URL | chicbuses.appspot.com |
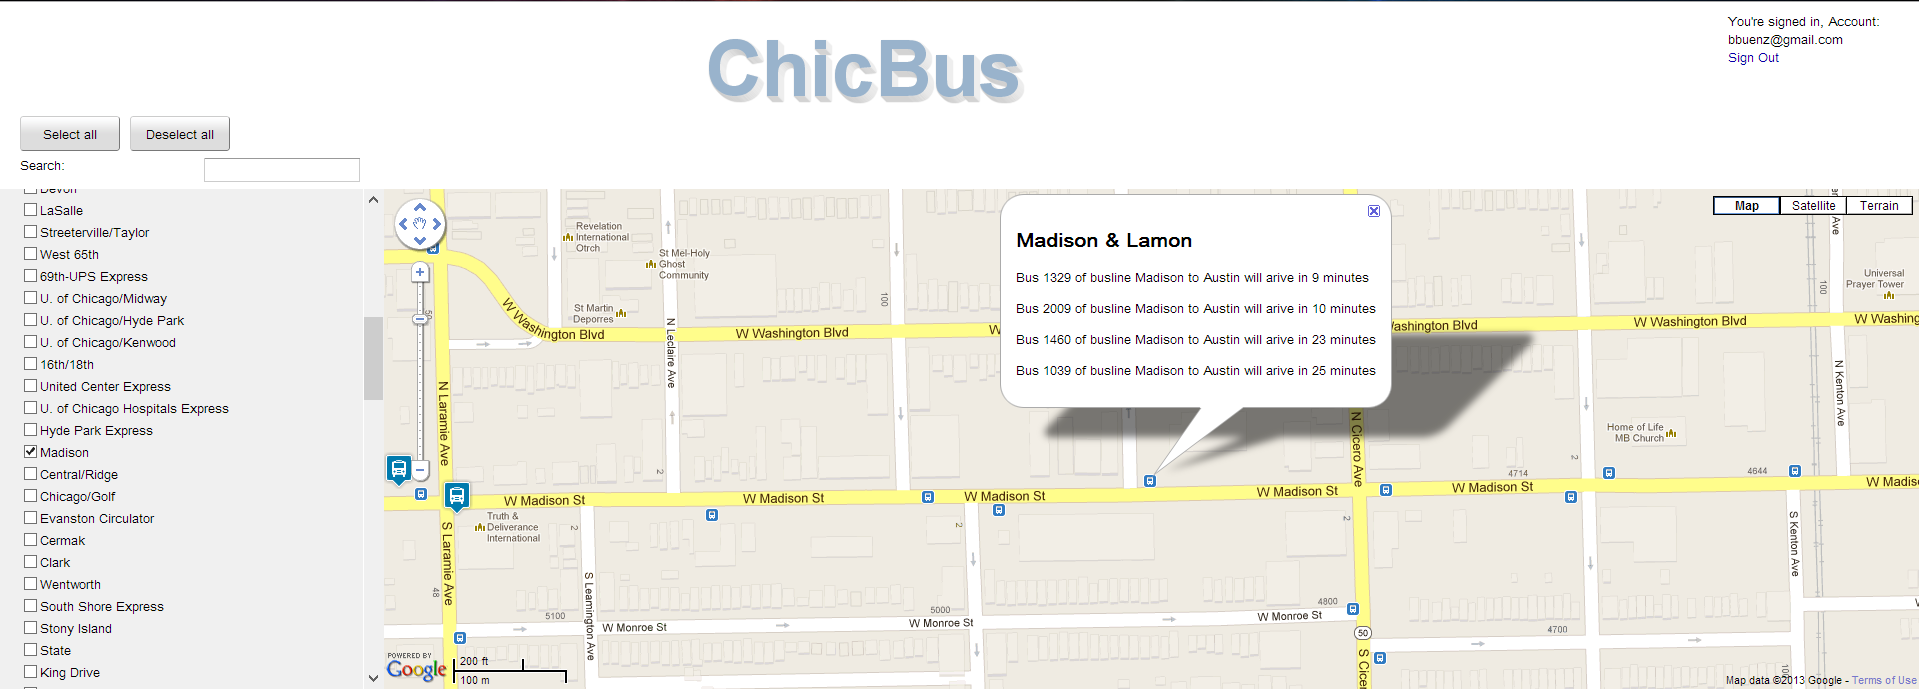
The ChicBusTracker tool is an online tracker for the Chicago bus system. It allows you to get an overview of where and how many buses currently are operating in Chicago. Furthermore it can display the specific information about a bus or a bus station, such as the arriving buses with their estimate time to arrival and their delayed status. You can also filter the bus lines that you want to be displayed and save this filter when logged in with a Google account. For a better overview the buses can be clustered when their density gets too high.
All data is updated automatically. Technically we used the Google Web Toolkit to create the back- and front-end of the application. We also utilized Google Maps to display the data.
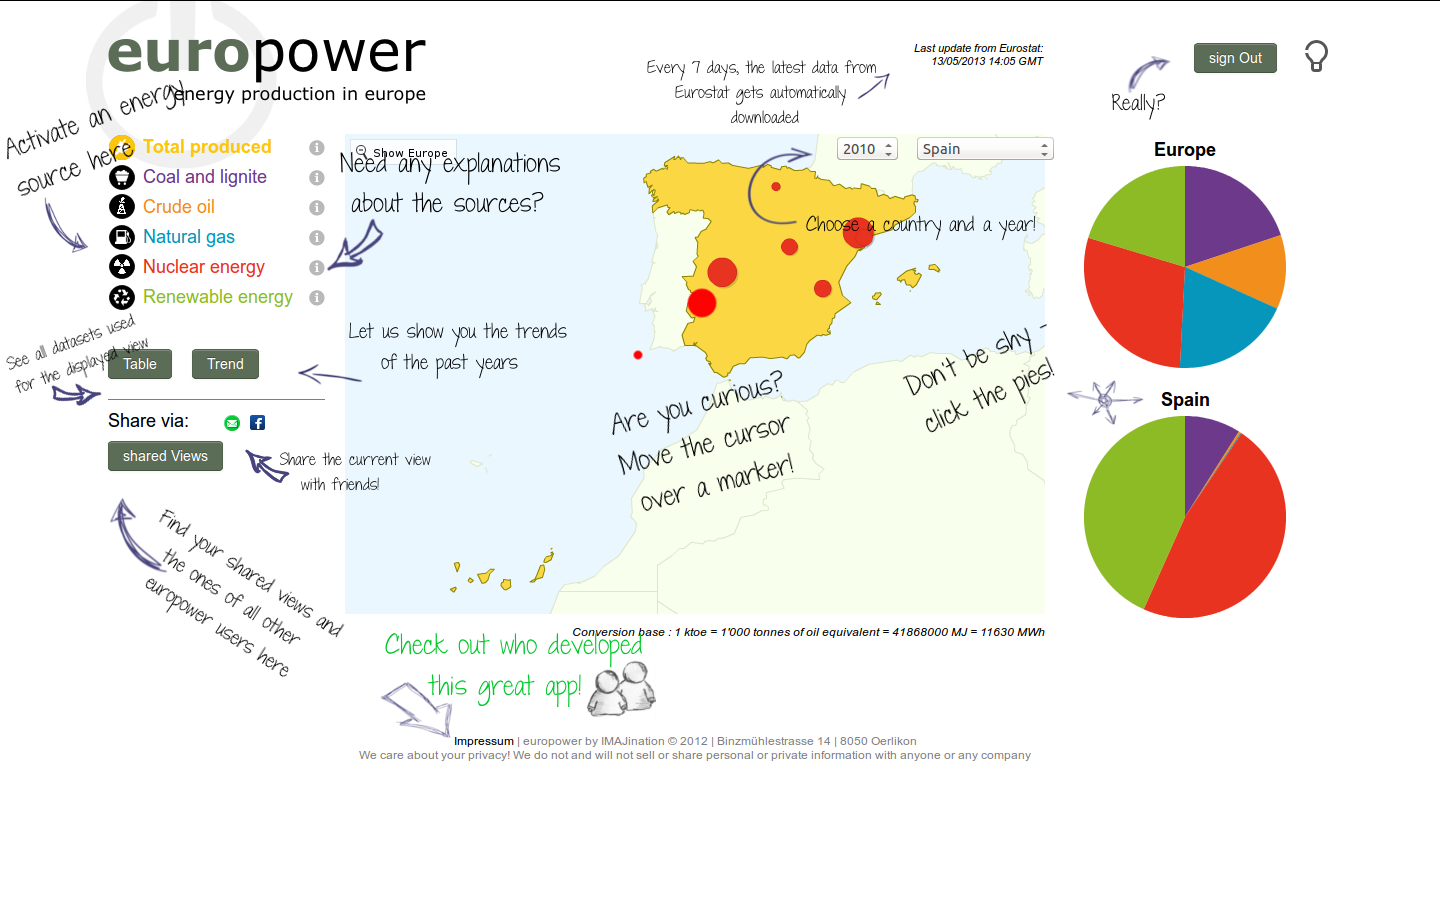
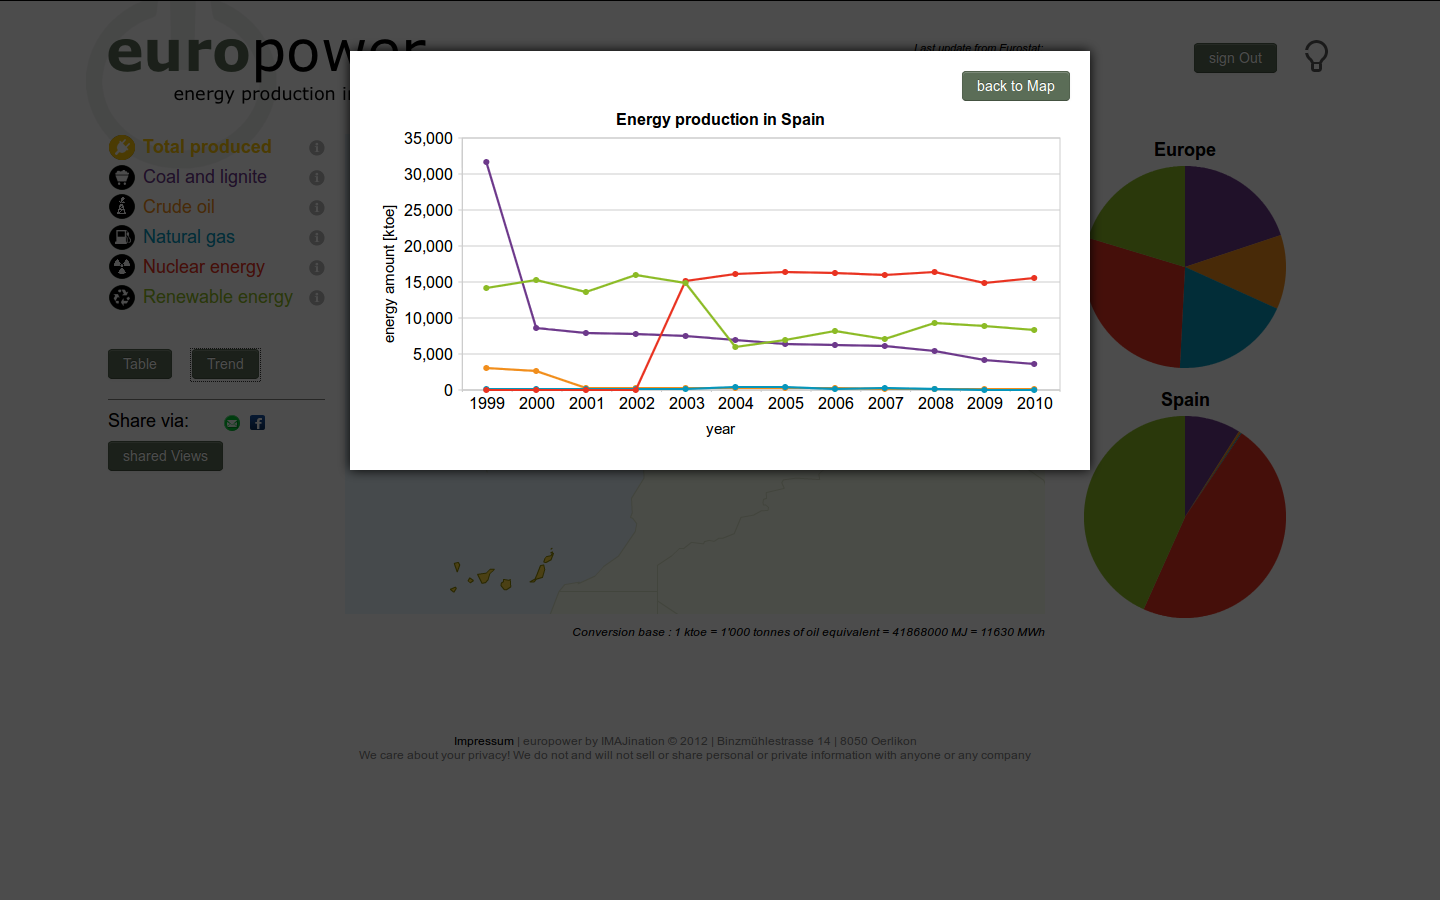
europower
| Team | Isabel Mueller, Manuel Roesch, Jennifer Studer and Annatina Vinzens |
| URL | gwteuropower.appspot.com |
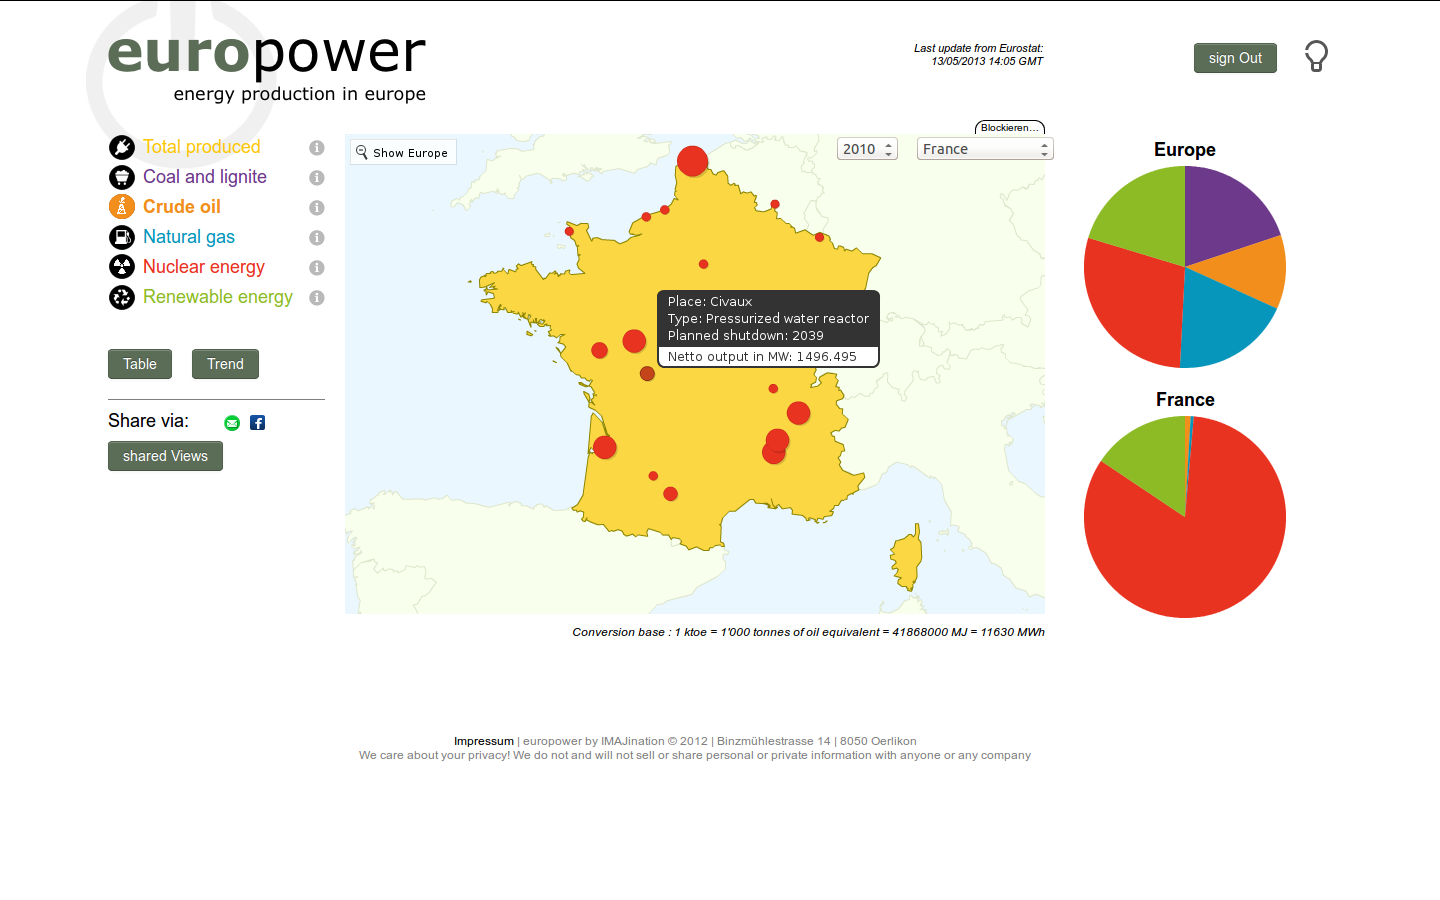
Project europower is all about the energy production in Europe. It’s a website which allows you to access all the data of the last twelve years in different ways. You can see them as colored Europe map, as pie, as line-chart or in simple table form. Moreover you have the possibility to get to know all the nuclear power plants of a country and you can share your favorite map with your friends. Last but not least the data of the page is updated automatically by the eurostat servers.
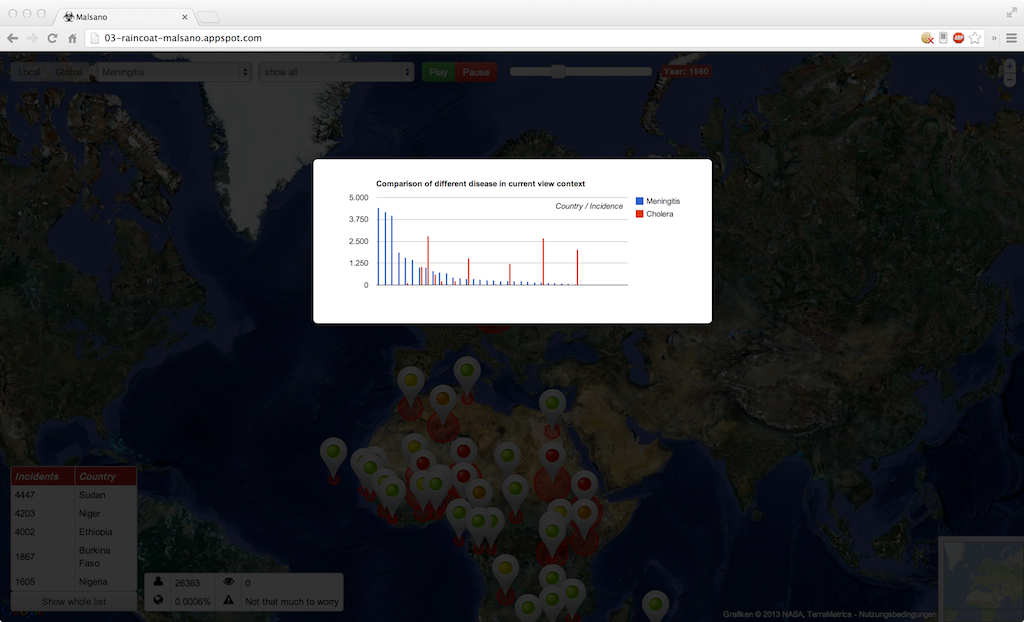
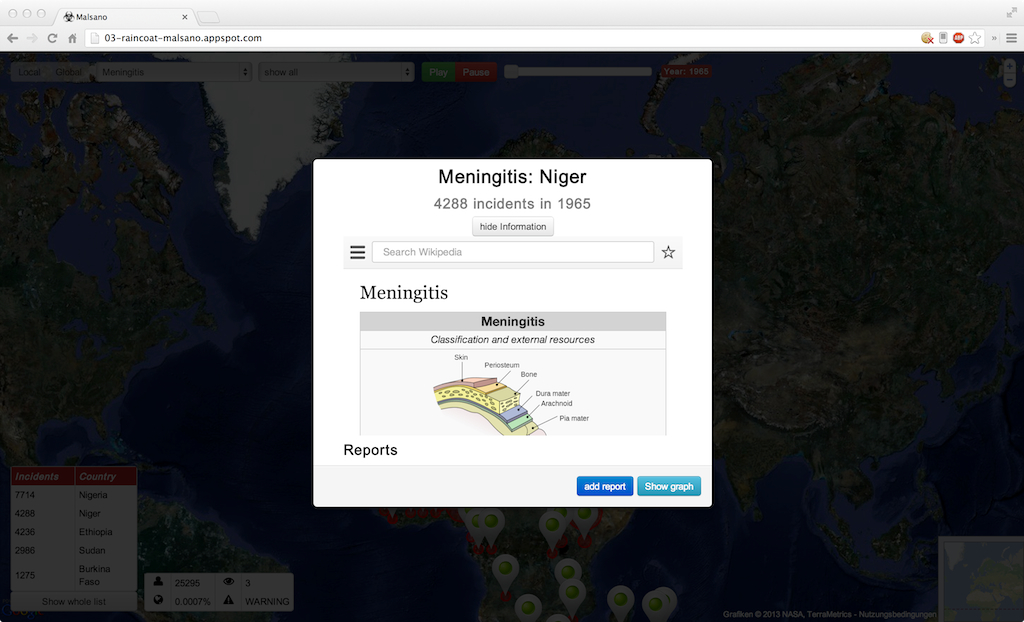
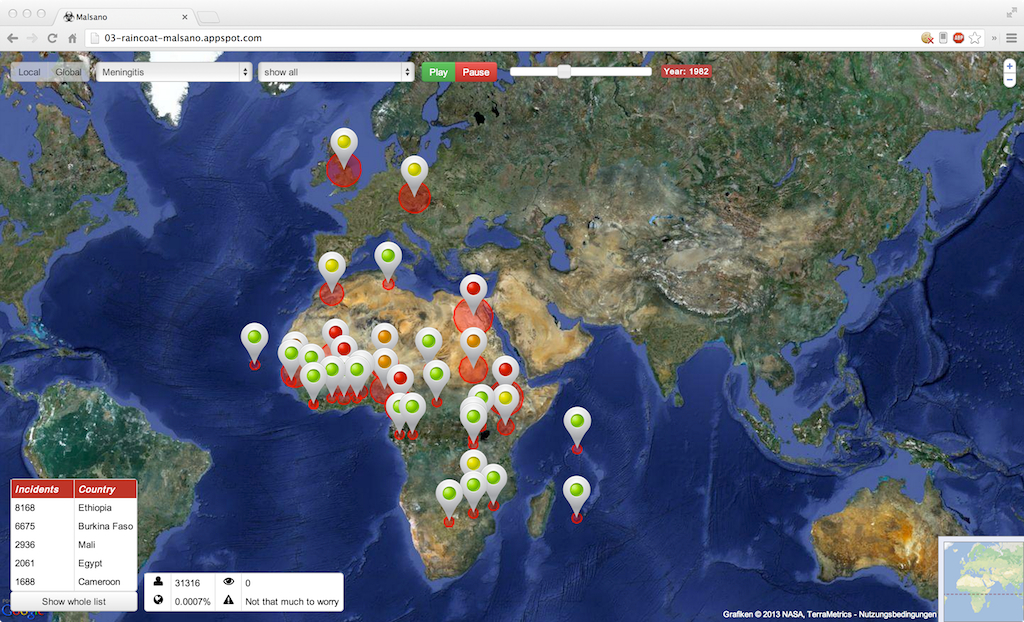
Malsano
| Team | Daniel Haeusler, Michael Spring, Christian Tschanz and Marco Unternaehrer |
| URL | 03-raincoat-malsano.appspot.com/ |

The goal of the project was to visualize the global distribution of diseases. The User can interactively explore the propagation and development of different diseases over a wide period of time. A variety of tools has been integrated to allow for a closer inspection of the various dimensions. The temporal aspect can be explored using a slider to go back and forth in time and comparisons between countries, diseases at different points in time can be generated. Informed users can annotate the data by leaving a report associated with a specific data point they discovered and might know more about. This can be used to link interesting changes or phenomena to news reports or other sources explaining the situation.
Used tools and technologies: GWT, jQuery, Bootstrap, Google Maps API.
Data source: WHO
More Pictures
ChicBus
europower
Malsano