Visual Analysis of Time Series
Introduction
Time-oriented data (time series) are among the most prominent and frequently applied data types. Examples include EEG data in medicine, stock charts in finance, or temperature progressions in Earth observation. Time series come with special syntactic and semantic characteristics that require individual if no unique treatment. Special analysis tasks include the exploration of motifs/shapes, the identification of periodic/cyclic patterns, as well as the identification of trends. Also, visualization and interaction research has produced a series of unique designs for time series data.
The visual analysis of time series data has a long tradition among the members of IVDA. Expertise can, e.g., be described along several research projects including time series.
Exploratory Search in Time Series Data
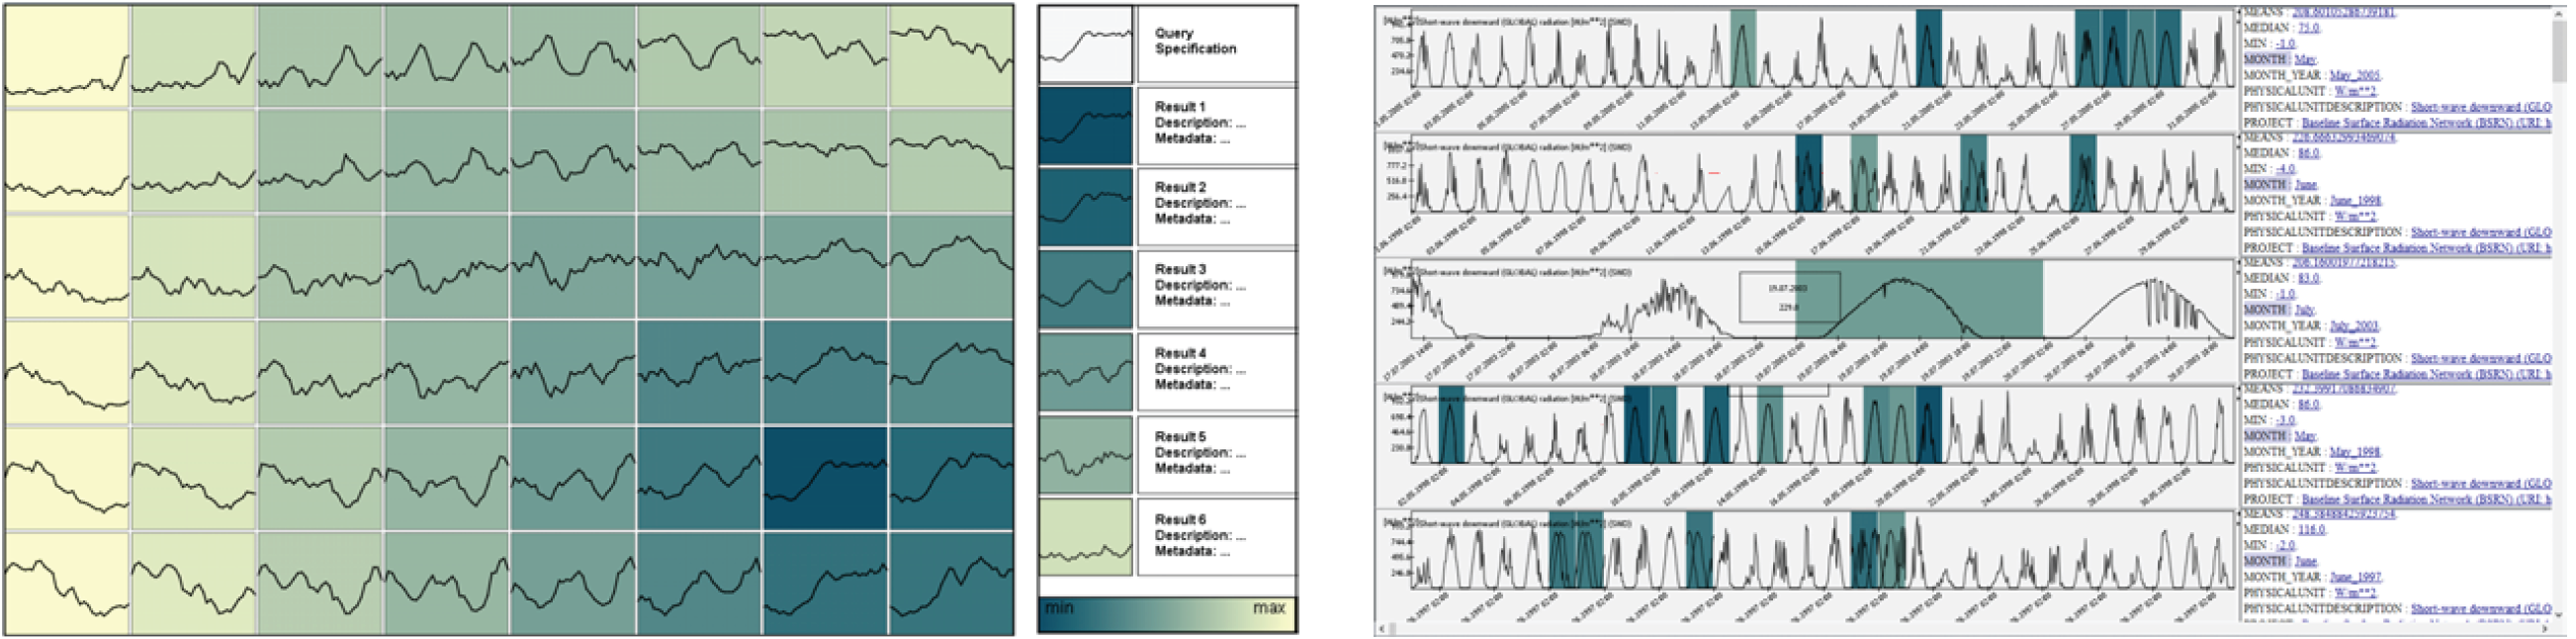
Exploratory search (ES) is a concept that seamlessly includes the information-seeking behaviors ranging from search to exploration. ES supports domain experts in both gaining an understanding of huge and potentially unknown data collections and the drill-down to relevant subsets, e.g., to validate hypotheses. As such, ES combines predominant tasks of domain experts applied to data-driven research. For the design of useful and usable ES systems (ESS) for time series data, data scientists have to incorporate different sources of knowledge and technology. Of particular importance is the state-of-the-art in interactive data visualization and time series data analysis.
In essence, our contributions in the ES of time series data cover the entire time series analysis process starting from accessing raw time-oriented data, processing and transforming time series data, to visual-interactive analysis of time series. We present
visual search interfaces providing content-based access to time-oriented primary data. In a series of novel exploration-support techniques, we facilitate both gaining an overview of large and complex time-oriented primary data collections and seeking relations between data content and metadata. We use VA as a means of designing effective and efficient visual-interactive systems. Our VA techniques empower data scientists to choose appropriate models and model parameters, as well as to involve users in the design. With both principles, we support the design of usable and useful interfaces which can be included into ESS. In this way, our contributions bridge the gap between search systems requiring exploration support and exploratory data analysis systems requiring visual querying capability.
Projects:
VisInfo: a digital library system for time series research data based on exploratory search—a user-centered design approach
MotionExplorer: Exploratory Search in Human Motion Capture Data Based on Hierarchical Aggregation
Interactive and Visual Preprocessing of Time Series
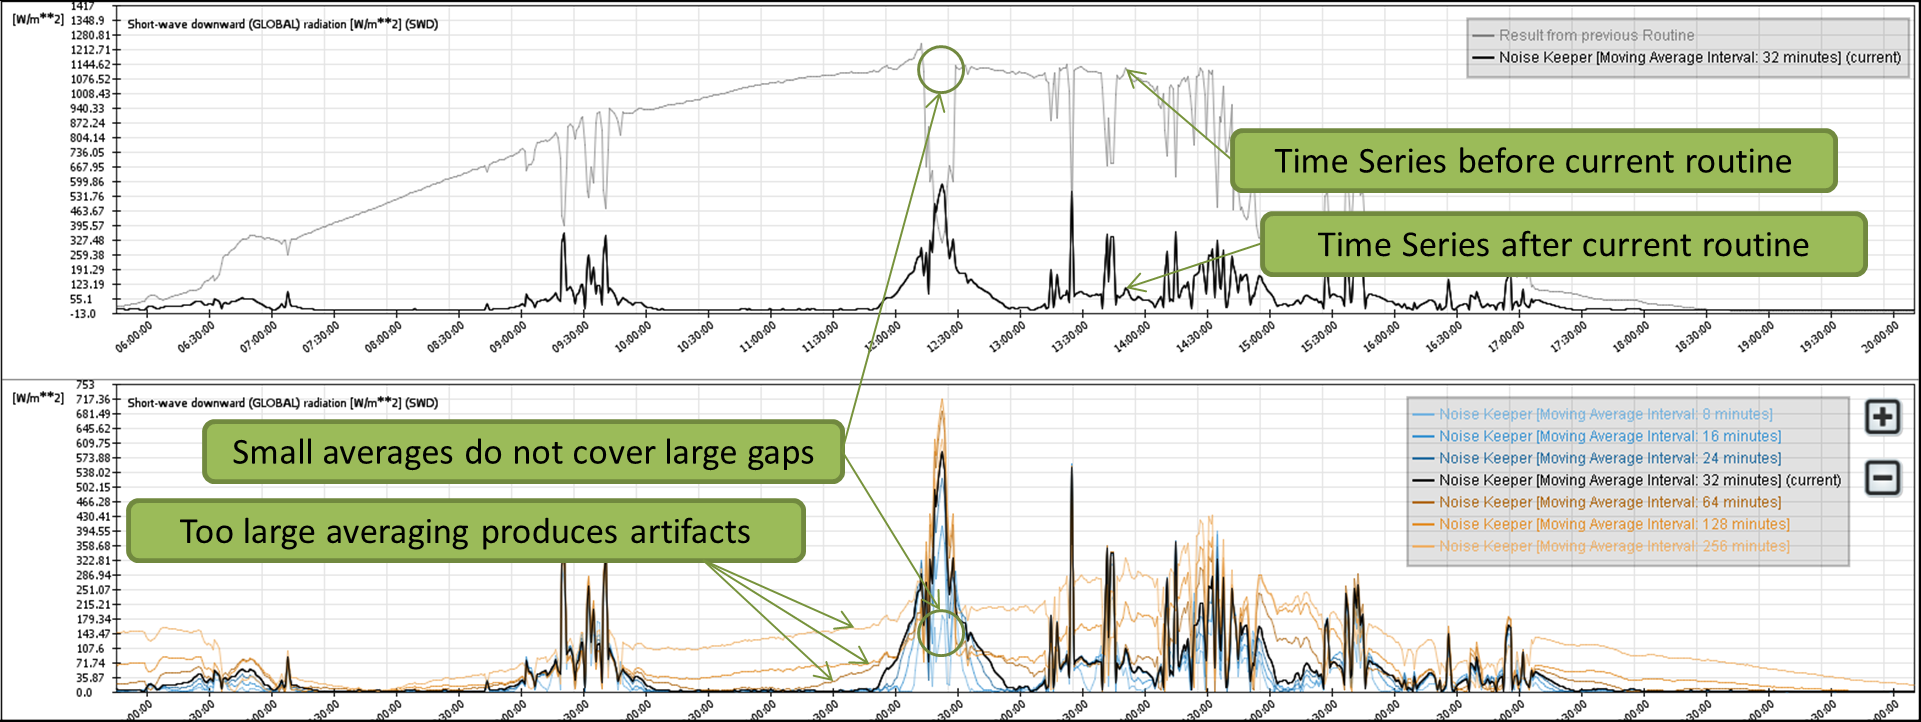
Given the importance of time series data a great variety of approaches for analyzing time series data exist. Within these approaches different strategies for cleaning, segmenting, representing, normalizing, comparing, and aggregating time series data can be found. When combining these operations, the time series analysis preprocessing workflow has many degrees of freedom. To define an appropriate
preprocessing pipeline, the knowledge of experts coming from the application domain has to be included into the design process. Unfortunately, these experts often cannot estimate the effects of the chosen preprocessing algorithms and their parameterizations on the time series.
Our research includes the visual-interactive exploitation of the preprocessing parameter space. In contrast to ‘black box’-driven approaches designed by computer scientists based on the requirements of domain experts, our systems allow these experts to visual-interactively compose time series preprocessing pipelines by themselves. Visual support helps to choose the right order and parameterization
of preprocessing steps. In the past, we demonstrated the usability of our approaches with many case studies, including the digital library domain, in which time-oriented scientific research data has to be preprocessed to realize a visual search and analysis application.
Projects:
Publications
Members of the IVDA group have been involved in more than 35 research papers on time series data. An overview of papers can be found here.