Human-Centered Ranking of Data Objects using Interactive Attribute Scoring Interfaces
Jenny Schmid has successfully defended her Master Thesis

Congratulations to Jenny, who has successfully defended her Master Thesis on Thursday Sept 16. Cheers!
Advertisment: we are looking for a Hiwi!
we are looking for a student assistant (HiWi) to help in the context of our ranking project!
Motivation
Ranking data objects in large data collections is an essential task in many data analysis and decision-making processes. Meaningful rankings of data collections help users answering a crucial analysis question: which data object (item) from a large item collection is most suitable to be selected for a given task? In our everyday life, a prominent example is identifying preferable items in digital shop environments. An example in professional decision-making is selecting most promising stocks for a financial investment portfolio.
Background - Ranking Models
From a data scientist’s perspective, one relevant question is how to rank an item collection in a way that is most useful for an individual user? As a result, most meaningful items can then be shown to the user in list-based interfaces. In this thesis, we refer to the set of most promising candidates as the result space. The identification and implementation of a ranking model that computes meaningful result spaces is a non-trivial design challenge. Ideally, systems would enable users to define individual ranking preferences according to a user’s information need and to apply the resulting ranking models in a user's workflow on the fly.
An example use case is a search system for used cars (as on comparis.ch) which enables users to rank cars based on multiple car characteristics (attributes). A user may, e.g., want to buy a used car which is...
- as ecological as possible
- as cheap as possible
- as new as possible, and has
- as few kilometers as possible.
While these attributes are particularly relevant to the user, this user may not care about the brand or the color of a car. Yet another user may have an entirely different information need – so ideally, the system would enable other users to rank items differently.
The number of alternative requirements of users to ranking models is sheer infinite. Also, the example of buying a used car can be transferred to a great many of other example use cases. However, current search systems hardly support users with expressing and exploiting their individual information need when it comes to item ranking.
Background - Overview of the Search Space
A second design question for data scientists refers to the data space in which items live. In this thesis, we refer to the entire collection of data items as the search space. According to Ben Shneiderman’s Information Seeking Mantra [1], it is good practice to start with gaining an overview of the data collection, understanding most crucial patterns, before drilling down to individual items and item details. Insights gained from such an overview of the search space typically helps to navigate towards meaningful items and to steer ranking models which support this drill-down process. The latter argument about combining and steering algorithmic models during data analysis is inspired by the idea of visual analytics. Visual Analytics combines automated analysis techniques with interactive visualizations for an effective understanding, reasoning and decision making based on large and complex data sets [2].
Depending on the expertise of users, questions about the overview of the search space may include: Are there groups of similar items (clusters) in the search space which should be investigated further or can be ignored as a whole? Do outliers exist which may be particularly relevant or irrelevant? Which other structures in the data exist which would help identifying meaningful candidate items? While these questions about the search space are item-focused (rows of a data table), attribute-focused (columns of a data table) questions shed light on a complementing perspective on data: What is the value distribution of an attribute like? Which attributes are useful to differentiate between items best? Are there missing values which may compromise the operability of ranking or filtering models? And ultimately: is an attribute useful for a ranking model?
Despite the usefulness of the Information Seeking Mantra in general, overviews of the search space have hardly been introduced in the context of item search and ranking systems so far.
Interactive Visual Data Analysis (IVDA)
IVDA has proven to be a promising approach to solve human-centered data analysis challenges. The particular benefit of IVDA tools is the ability to combine the strengths of both humans and machines in a unified data analysis workflow.
Thesis Goal
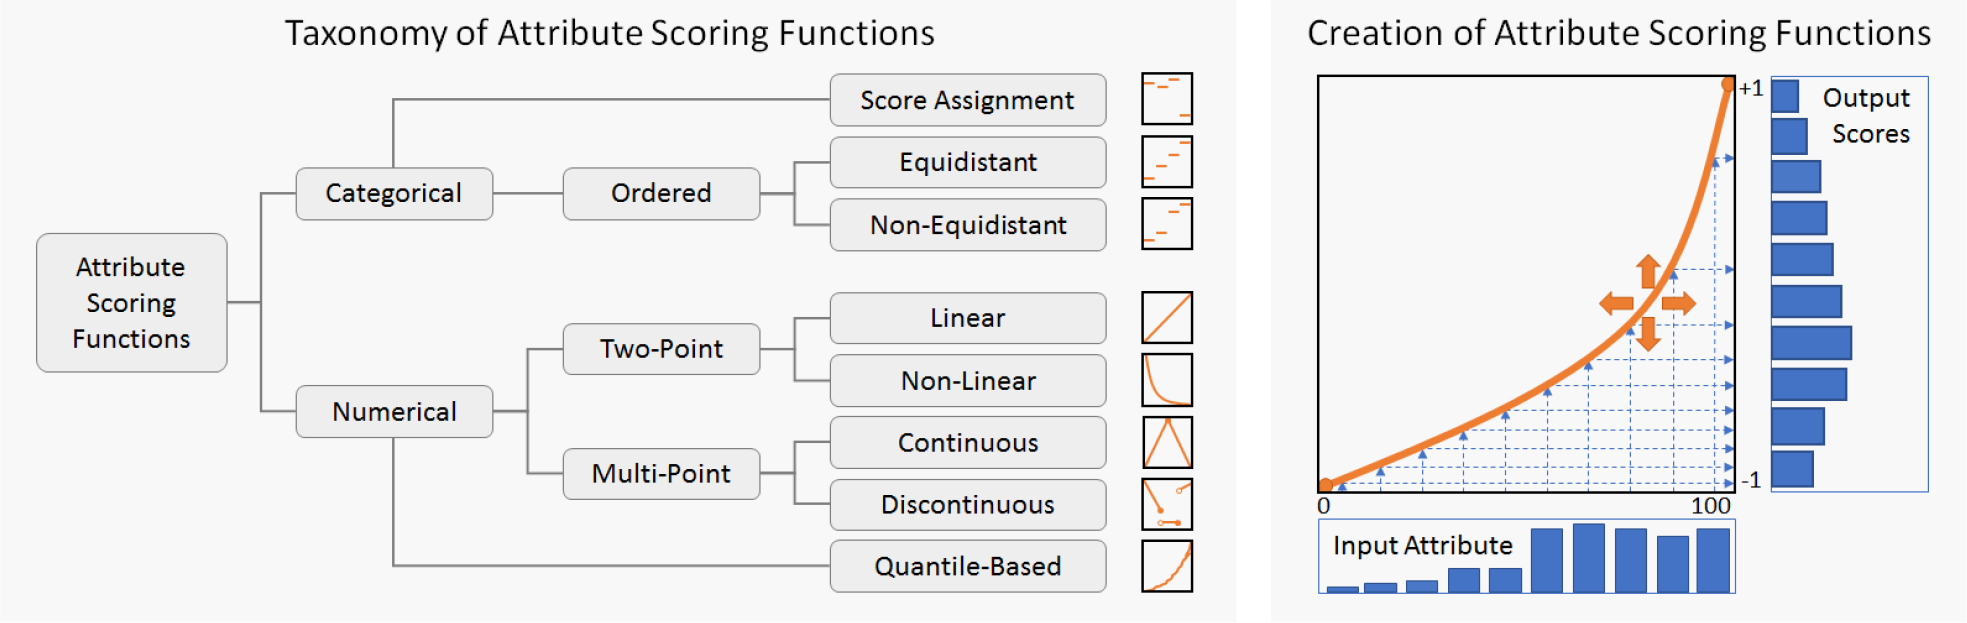
Goal of this thesis is to design, implement, and validate an interactive visual data analysis (IVDA) system to support users with ranking large collection of data objects (items). To overcome remaining problems, the approach will allow users to define, modify, and execute individual ranking models in an interactive visual interface at runtime. The definition of ranking models is based on the attributes of the data collection: users can a) weight the importance of individual attributes and b) assign item scores depending on the attribute values of items. An example for b) is an interactively defined scoring function that continuously assigns scores between 1.0 to 0.0, depending on the price of an item (0.0 for the most expensive item in the collection). In a second view, users will be able to analyze the result space in detail, which is calculated by the ranking model at hand. These functionalities will be provided in different views in the IVDA tool. To gain an overview of the search space of the underlying item collection, the IVDA tool will also provide an interactive visual interface that enables users to analyze patterns in the item collection. All main views of the tool should be interactively linked, i.e., user interactions such as object selections made in one view are automatically propagated to (and made visible in) the other views. The visual data encodings as well as the general design of the visual representations of the IVDA tool should correspond to the guidelines for good visualization design [5].
Data
The data objects of the underlying data collection will contain multiple attributes, i.e., the data collections at hand are multivariate datasets which can be structured in a tabular form. In this notion, items (objects) define the rows of the table, whereas data attributes refer to the columns. Attributes can be of numerical type (continuous or discrete), of categorical type, or of binary type.
Approach
The frontend of the IVDA tool will communicate with a backend where data is loaded, stored, and processed. Also, ranking models and other functional support will be provided with the backend. According to the visual analytics principle [2], visual interfaces in the frontend and algorithmic components in the backend are tightly coupled, allowing users to steer backend components and to see changes of model outputs in the frontend (repaint) at interactive frame rates.
Validation
Two datasets will be determined in a joint discussion at thesis start and should be used throughout the entire thesis project. To show the generalizability of the IVDA tool, it is strongly recommended to develop and test with both datasets. A recommended validation strategy is to conduct one usage scenario for every dataset. A usage scenario is a “walkthrough” through the envisioned analysis and interaction workflow of a potential user using IVDA tool. The walkthrough can be executed by the student, the involvement of real users is not necessary for usage scenarios. A (small-scale) user study is (with user involvement) is not necessary to pass the master thesis but may have a positive effect on the thesis quality.
Requirements
- Programming experience in Python or willingness to learn. Alternative: Java
- Knowledge about interactive data visualization and data processing
- Basic knowledge about machine learning.
- Decent understanding of written English.
Related Work
[1] Shneiderman, Ben. "The eyes have it: A task by data type taxonomy for information visualizations." Proceedings 1996 IEEE symposium on visual languages. IEEE, 1996.
[2] Keim, Daniel, et al. "Visual analytics: Definition, process, and challenges." Information visualization. Springer, Berlin, Heidelberg, 2008. 154-175.
[3] Hearst, Marti. Search user interfaces. Cambridge university press, 2009.
[4] White, Ryen W., and Resa A. Roth. "Exploratory search: Beyond the query-response paradigm." Synthesis lectures on information concepts, retrieval, and services 1.1 (2009): 1-98.
[5] Munzner, Tamara. Visualization analysis and design. CRC press, 2014.