Interactive Visual Data Labeling [in prep]
Introduction
The assignment of labels to data instances is a fundamental prerequisite for most supervised machine learning tasks. Data labeling is typically conducted by humans, which can be tedious and error-prone, especially if the required training dataset is large. In many real-world applications, user groups in research and industry urgently need more effective labeling approaches, as a prerequisite to start building their own machine learning solution. A variety of types of data instances exist that require labels, including images, audio, time series and event sequences, text documents. Also, the characteristics of label alphabets can vary considerably: from binary labels (true/false), over multi-class alphabets (Apples, Oranges, etc.) to label hierarchies, such as the 17 SDG goals and sub-categories.
Labeling is one of the main bottlenecks in many machine learning approaches.
Labeling is also a frequently applied method in for visual interactive data analysis, e.g., to enable users to express their preference on data instances, for a more personalized data analysis experience. Interestingly, the methods for creating labels usually differ considerably between the machine learning and the interactive visual data analysis realm. This raises the question of whether synergies between the different approaches can be attained.
In this Ph.D. project, we will study the process of labeling data instances with the user in the loop, from both the machine learning and interactive data visualization perspective. The project is building upon the “Visual Interactive Labeling” (VIAL) process that unifies both perspectives. VIAL describes the six major steps of the process and discusses their specific challenges. The Ph.D. project will address general challenges to VIAL and include necessary work for the realization of future VIAL approaches.
Application Example: Labeling Publications by Sustainability Goals
.png)
The 17 SDG goals form an interesting machine learning task that we want to study as one representative labeling application: can we effectively identify sustainability contributions in scientific publications? For that purpose, an AI component will be fed with a growing training dataset of scientific publications; this training dataset will interactively and iteratively be extended with additional labeled publications, as the result of a human-machine collaboration approach.
Combining the strenghts of humans and machines in data labeling

The VIAL process. Four algorithmic models (green) and two primary visual interfaces (red) are assembled in an interactive and iterative labeling process. To resemble the special characteristics of the Active Learning and the Visualization perspective, the VIAL process contains a branch (from “Learning Model” to “candidate suggestion” and “result visualization,” since both are complementary). The VIAL process can be applied for data exploration and labeling tasks. The output of the VIAL process is threefold: labeled data, learned models, and gained knowledge.
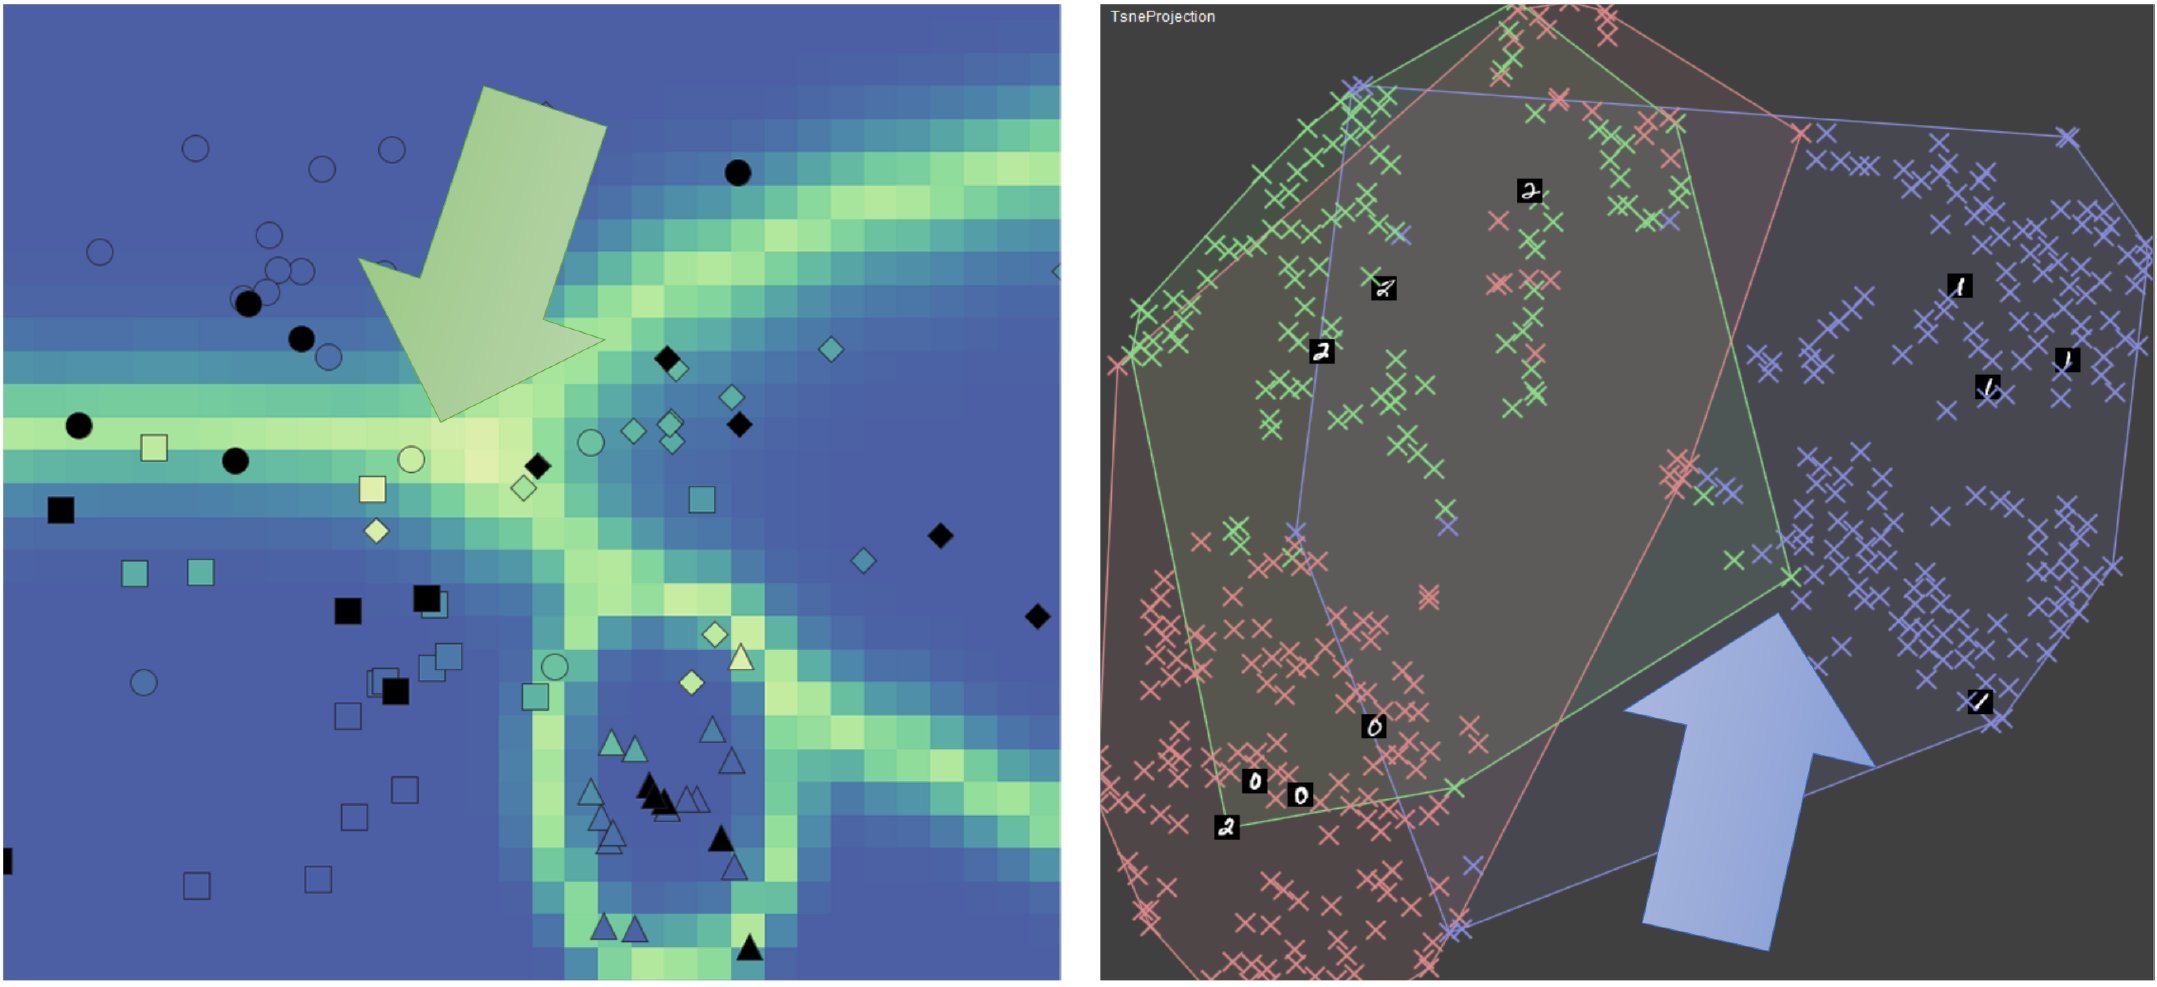
Selection of instances for labeling by machines and/or humans

Complementary strengths of model-based and user-based instance selection for data labeling. Left: visualization that explains the decision boundaries of a classifier using bright colors. Uncertainty-based AL strategies (model-based) will select instances near the decision boundaries. Right: visualization that explains the prediction of a classifier for unlabeled data (colors). Users selecting instances may want to resolve the local green class confusion.
General Information and Contact
For general information about the position, please see the hub page for open PhD positions