Visual Analytics for Multiple Sclerosis
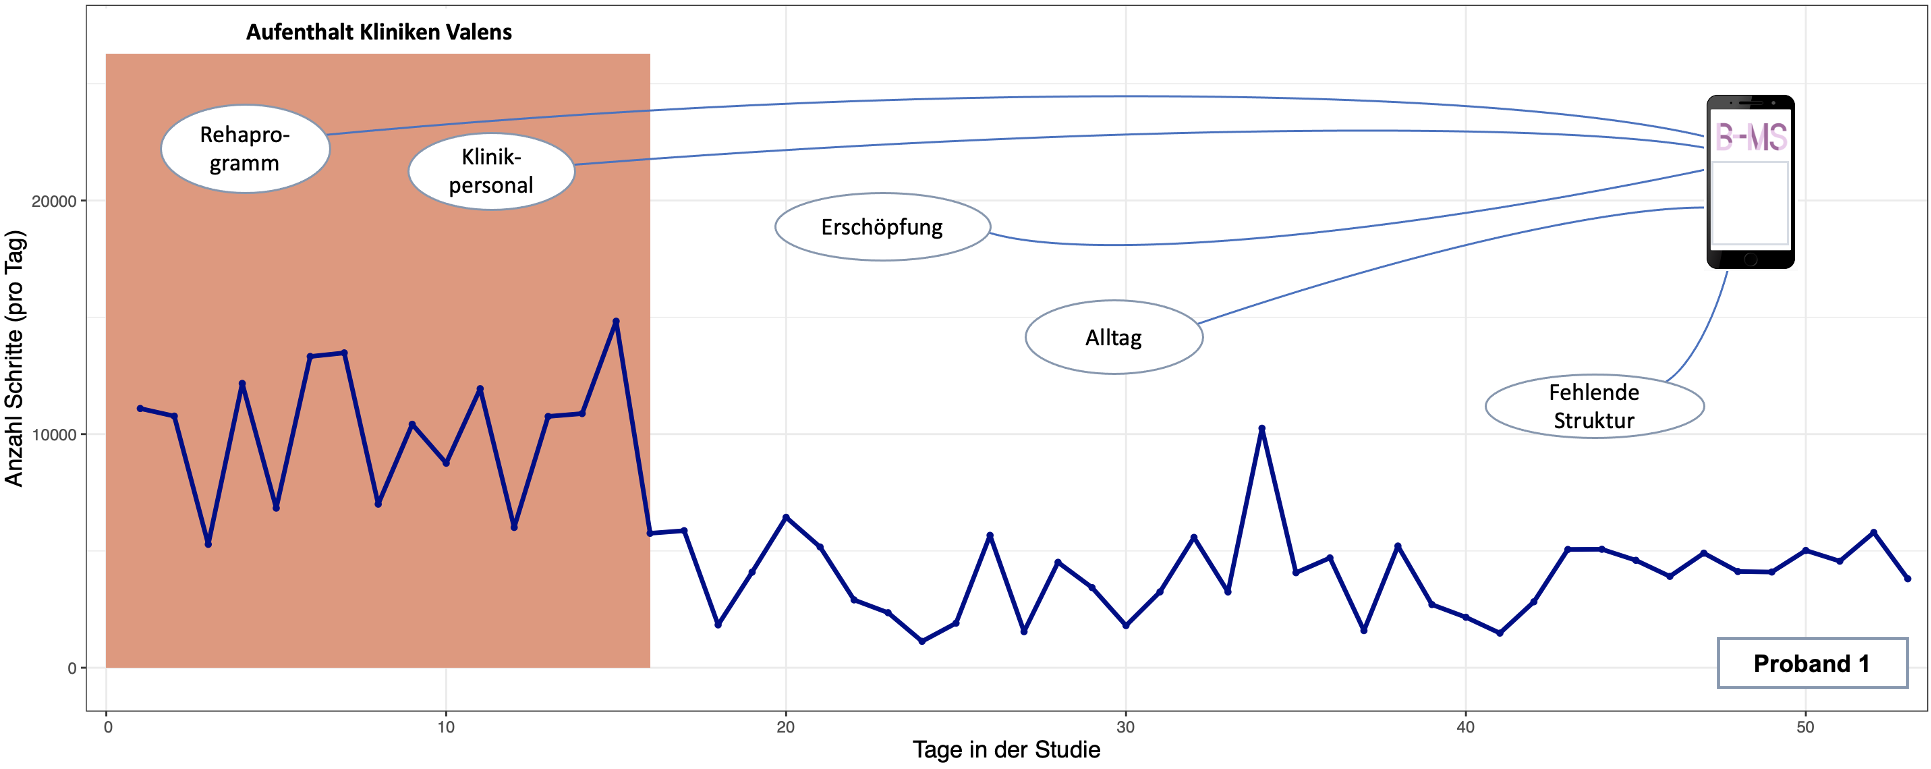
Mockup data as recorded in a study on Multiple Sclerosis for a single patient. The step count of a patient is recorded for every day, here visualized as a linechart. In addition, a variety of other types of (sensor) data is recorded over time, e.g., by using wearables:
- Acceleration data
- Motion-behavior data
- Everyday life and well-being data
- Weather data
Background
The analysis of medical data is relevant for many use cases, including clinical research and patient treatment. While these cases typically represent a doctors'/physicians' perspective, there is yet another user group with an immense information need: patients. In addition, other types of stakeholders involved in the medical domain are, e.g., clinics, quality management environments, operational staff, and insurances.
Chronic diseases such as Multiple Sclerosis (MS) create a huge burden for patients and their relatives. With the availability of wearables and other types of (sensor) data, it is now possible to apply data-driven approaches to contribute to patient health. Of particular interest is the identification of biomarkers for the reliable detection of relevant health changes of MS patients. The identification of biomarkers can be performed with two complementary approaches: exploratory data analysis (the data scientists' preferred approach) and confirmatory data analysis (the epidemiologists' preferred approach). Different types of techniques borrowed from Machine Learning, Data Mining, and Information Retrieval may be applied and combined to provide effective and efficient solutions for the analysis of medical and patient-related data.
Despite its benefit, the analysis of medical data comes with a series of challenges. First, data from different sources need to be combined to a unified data collection. Second, data collections such as electronic health records often have quality problems and require manual (pre-) processing. Third, algorithmic models applied to medical data need to be selected, parameterized, trained, and validated. In most cases, this process is iterative and urgently requires humans in the loop. Fourth, the analysis of model outputs is often not trivial and decisions of models are not always explainable. Finally, involved user groups such as physicians, patients, but also operational staff have very different levels of expertise and interest, which requires a careful characterization of the domain problem and analysis tasks to ensure that the tool to be built is both usable and useful.
Approach
Interactive Visual Data Analysis (IVDA) has proven to be a promising approach to medical data analysis. The particular benefit of IVDA tools is the ability to combine the strengths of both humans and machines in a unified data analysis workflow.
Thesis Goal
The goal of this project includes the design, implementation, and validation of IVDA approaches to support different stakeholders to study data about MS and to identify, assess, and validate biomarkers. From start, a multi-modal dataset will be available, as a basis for unification, data processing, and analysis. We will have the chance to get in touch with experts in the medical domain, to learn about particular domain problems and analysis tasks. In iterative design phases, different data science workflows will be designed and interactive visual interfaces for the visual analysis of the medical data be implemented. Different types of validation efforts will be conducted to ensure that the IVDA approaches are useful and usable to address the identified medical data analysis problems.
Requirements
- Programming experience in Python
- Knowledge about interactive data visualization and data processing
- Basic knowledge about machine learning
- Decent understanding of written English
- Willingness to collaborate with experts in the medical domain, by conducting a problem-driven research methodology
Prof. Dr. Jürgen Bernard The applications should be sent to bernard@ifi.uzh.ch. For questions, feel free to contact Prof. Bernard using this Email as well. |
|