Pre-Doc Position: Interactive Visual Search and Exploration for Digital Libraries
A digital library (DL) is a database of digital objects (documents, items) that can include text, still images, audio, video, digital documents, or other digital media formats or a library accessible through the internet.
Digital library systems (DLS) enable users to gain access to digital objects (documents, items) through interactive search and filtering capability. In future, DLS may also support exploration and data analysis capabilities to enable users gaining insights even while browsing for interesting digital objects. This is where methods and techniques developed in IVDA can help most.
Pre-Doc Position on the Interactive Visual Search and Exploration for Digital Libraries
This PhD position focuses on changing paradigms on how digital libraries and digital library systems will support future users searching for digital documents, items, and objects of any kind. Examples include various types of textual documents, research data, multimedia data, shopping items, and more.
The vision is to enhance today's digital library services with methods and techniques developed in the realm of IVDA. Thus, main contributions will be to transfer technology into a data-intensive environment that, however, lacks sophisticated computer science and data science capability.
Possible directions include:
- Enhanced interactive and visual search and filtering techniques
- Data exploration as a means to foster knowledge generation through DLs
- Content-based access to complex digital objects
- Search for similarity measures that would be most useful
- Human-centered digital library services with the human at the center of design thinking
- Design studies, user-centered design, and UX design
Example for a Digital Library System for Time Series Documents [1]
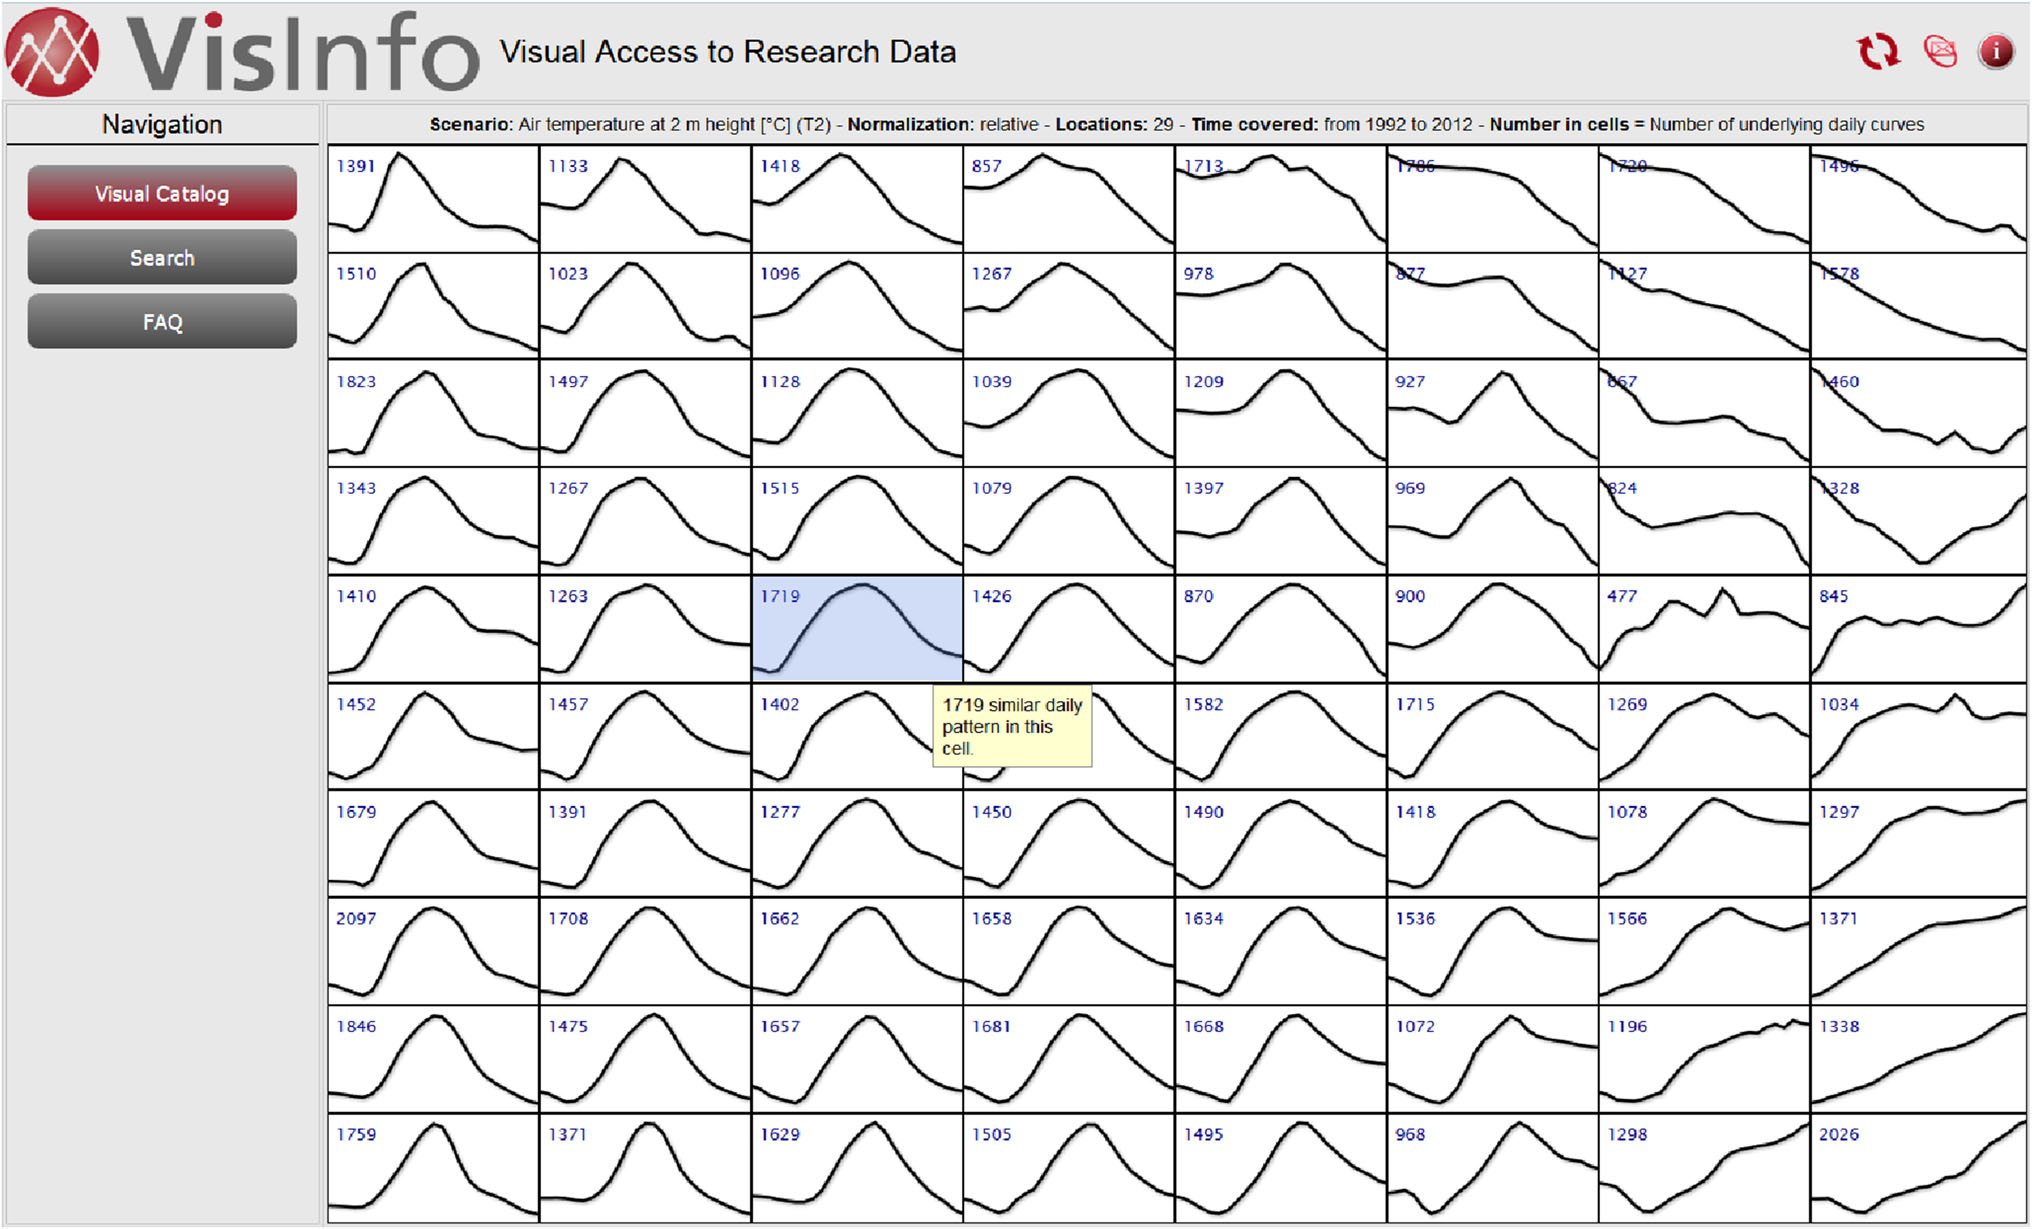
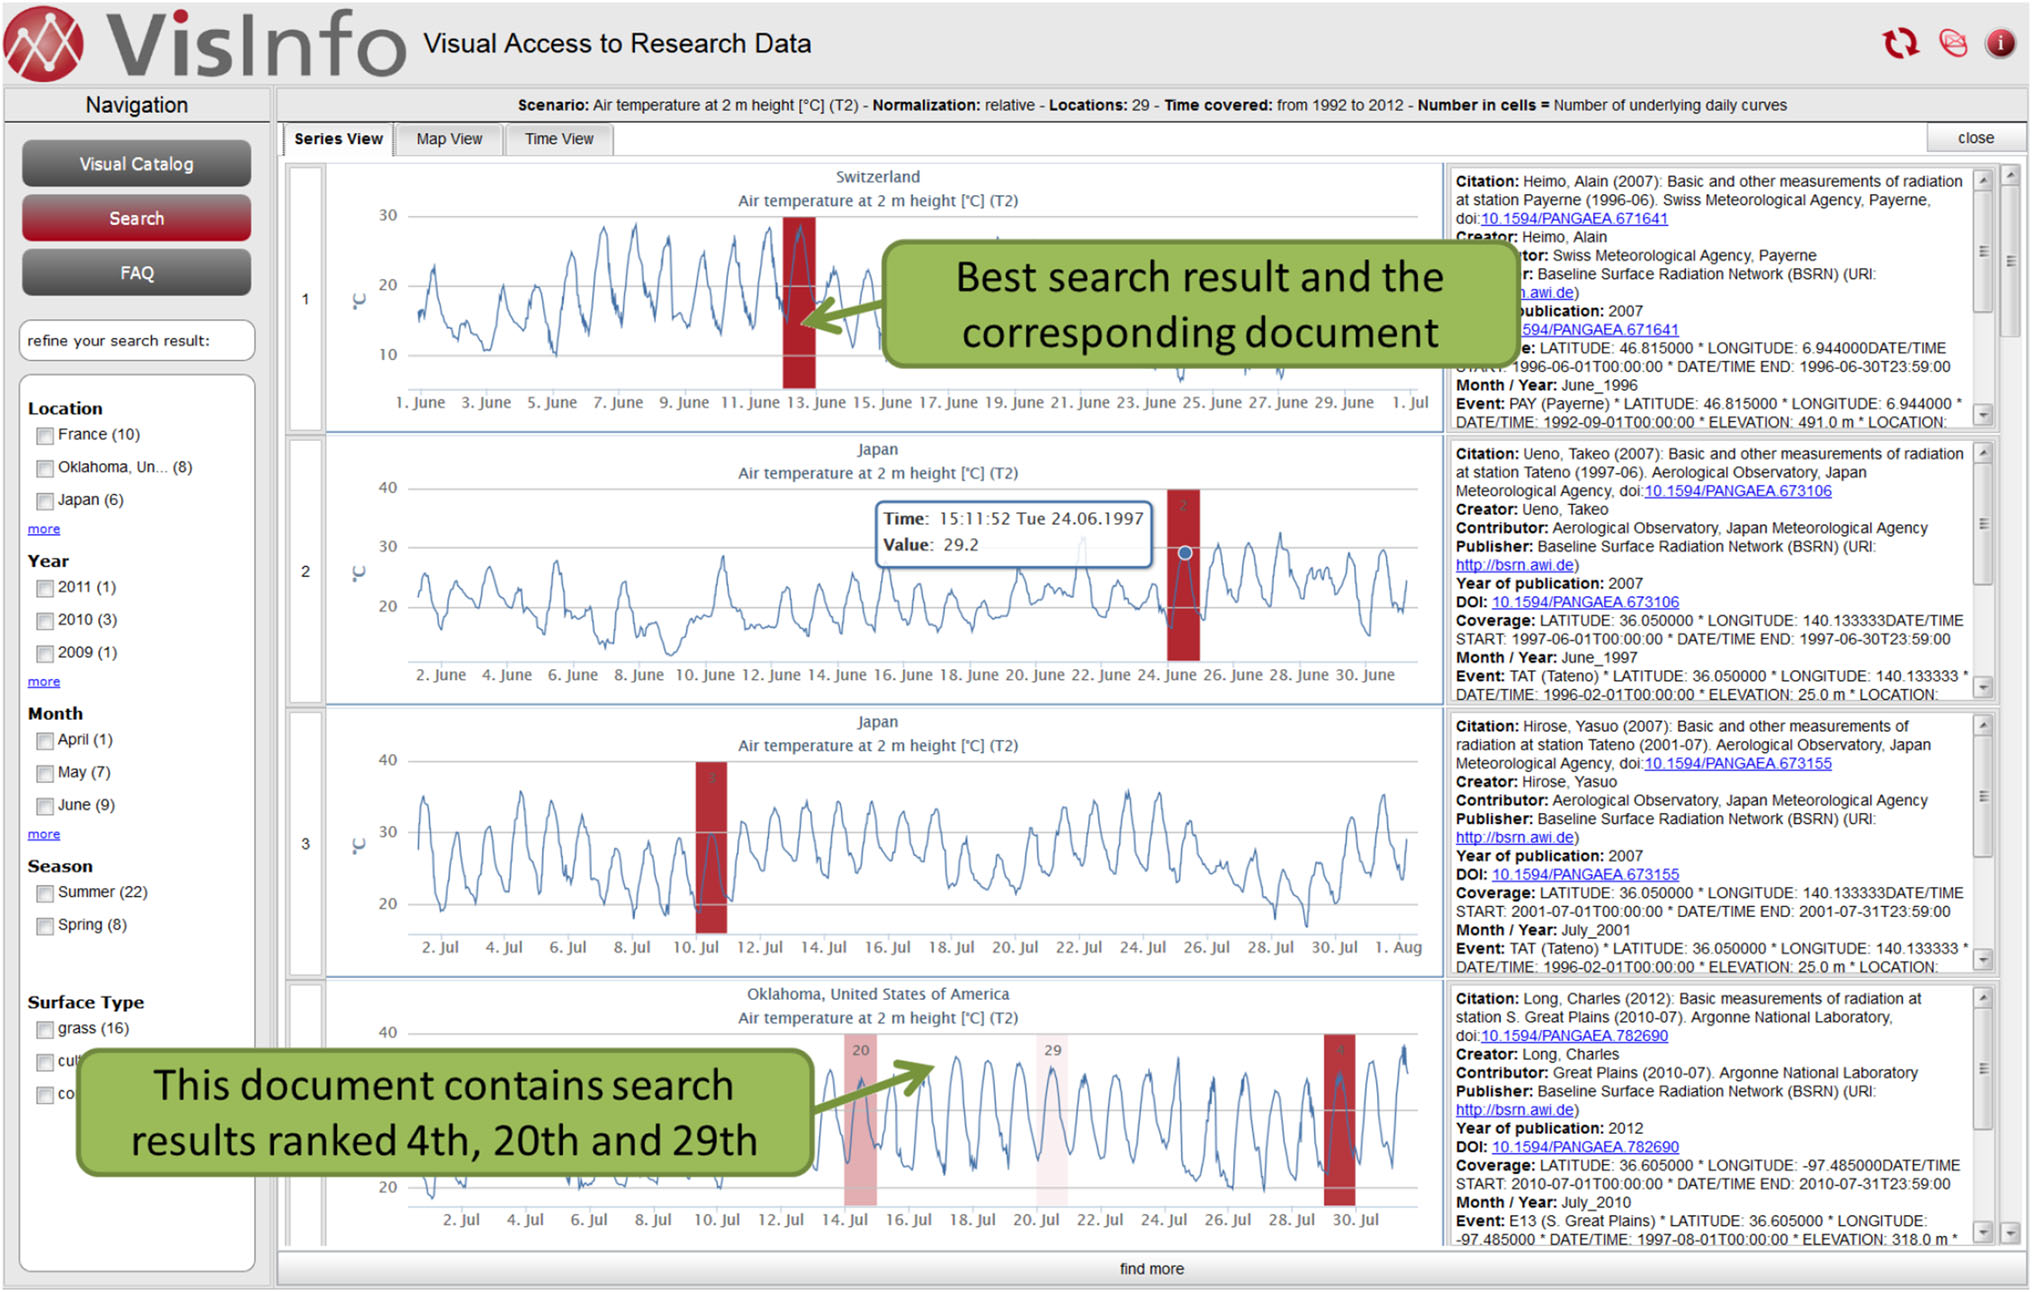
To this day, data-driven science is a widely accepted concept in the digital library (DL) context. In the same way, domain knowledge from information visualization, visual analytics, and exploratory search has found its way into the DL workflow. This trend is expected to continue, considering future DL challenges such as content-based access to new document types, visual search, and exploration for information landscapes, or big data in general. To cope with these challenges, DL actors need to collaborate with external specialists from different domains to complement each other and succeed in given tasks such as making research data publicly available. Through these interdisciplinary approaches, the DL ecosystem may contribute to applications focused on data-driven science and digital scholarship. In this work, we present VisInfo, a web-based digital library system (DLS) with the goal to provide visual access to time series research data. Based on an exploratory search (ES) concept, VisInfo at first provides a content-based overview visualization of large amounts of time series research data. Further, the system enables the user to define visual queries by example or by sketch. Finally, VisInfo presents visual-interactive capability for the exploration of search results. The development process of VisInfo was based on the user-centered design principle. Experts from computer science, a scientific digital library, usability engineering, and scientists from the earth, and environmental sciences were involved in an interdisciplinary approach. We report on comprehensive user studies in the requirement analysis phase based on paper prototyping, user interviews, screen casts, and user questionnaires. Heuristic evaluations and two usability testing rounds were applied during the system implementation and the deployment phase and certify measurable improvements for our DLS. Based on the lessons learned in VisInfo, we suggest a generalized project workflow that may be applied in related, prospective approaches.
General Information and Contact
For general information about the position, please see the hub page for open PhD positions
References
- [1] VisInfo: a digital library system for time series research data based on exploratory search—a user-centered design approach Bernard, J., Daberkow, D., Fellner, D., Fischer, K., Koepler, O., Kohlhammer, J., Runnwerth, M., Ruppert, T., Schreck, T., Sens, I. International Journal on Digital Libraries (IJoDL), Springer pp. 37-59, (2015). doi: 10.1007/s00799-014-0134-y