Interactive Machine Learning
Introduction
Interactive Machine Learning focuses on human-centered aspects of Machine Learning and the iterative machine learning process. Overall goal is to train powerful machine learning models by combining both the strengths of humans and machines.
IML at IVDA
Our research in Interactive Machine Learning is based on our expertise in the design of interactive visual interfaces on the one hand and by leveraging non-visual data analysis capability on the other hand. Particular research interests on concepts, techniques, and applications are along the following methodologies and research branches:
- Information Visualization is a branch of visualization research that focuses on enabling users to interact with visual representations of abstract (non-spatial) data.
- Visual Analytics is one means to conduct Interactive Machine Learning. IVDA combines a broad set of competences reflected by supported data types, analysis techniques, and application areas.
- Human-Centered Artificial Intelligence follows the idea that well-designed AI technologies should offer high levels of human control and high levels of computer automation, to increase human performance, and leading to wider adoption.
- Interactive Data Labeling helps to support the data labeling process in an effective and efficient way. Labeling is an important precondition for supervised Machine Learning tasks.
- Interactive Similarity Search is the research for similarity functions for data objects or digital documents, performed in a visual-interactive and human-centered way.
Publications
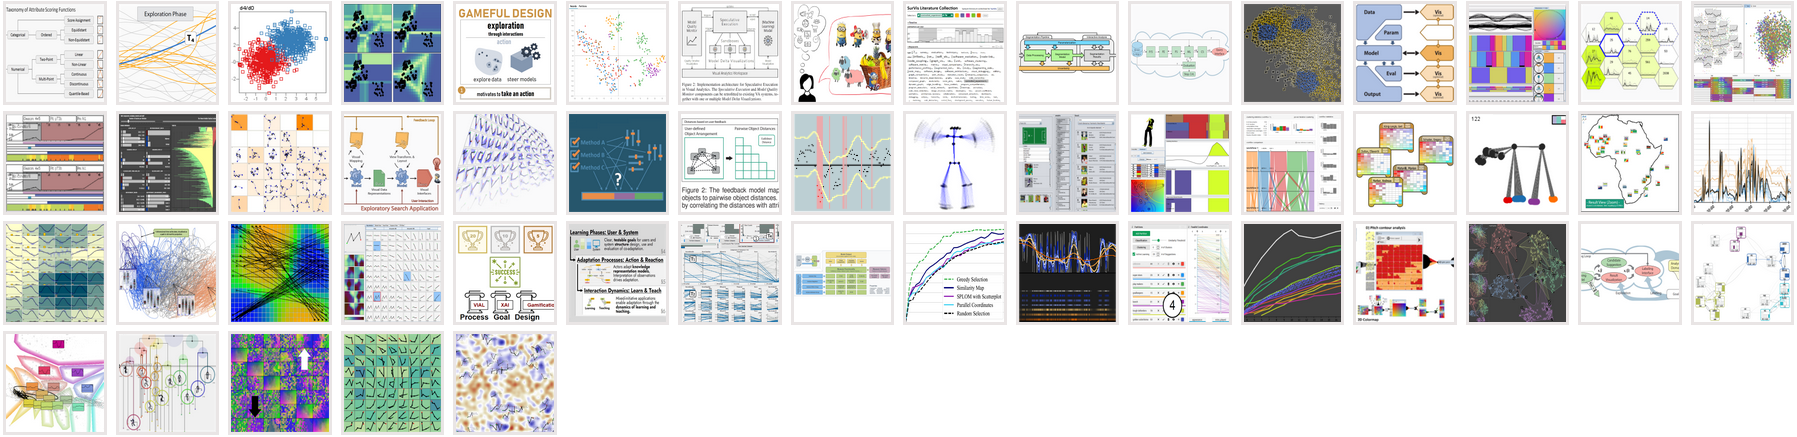
Members of IVDA have published more than 50 research papers, all of which addressing Interactive Machine Learning capability. The following hub website provides an overview of Interactive Machine Learning papers.
Example Project: Class Separation Measures
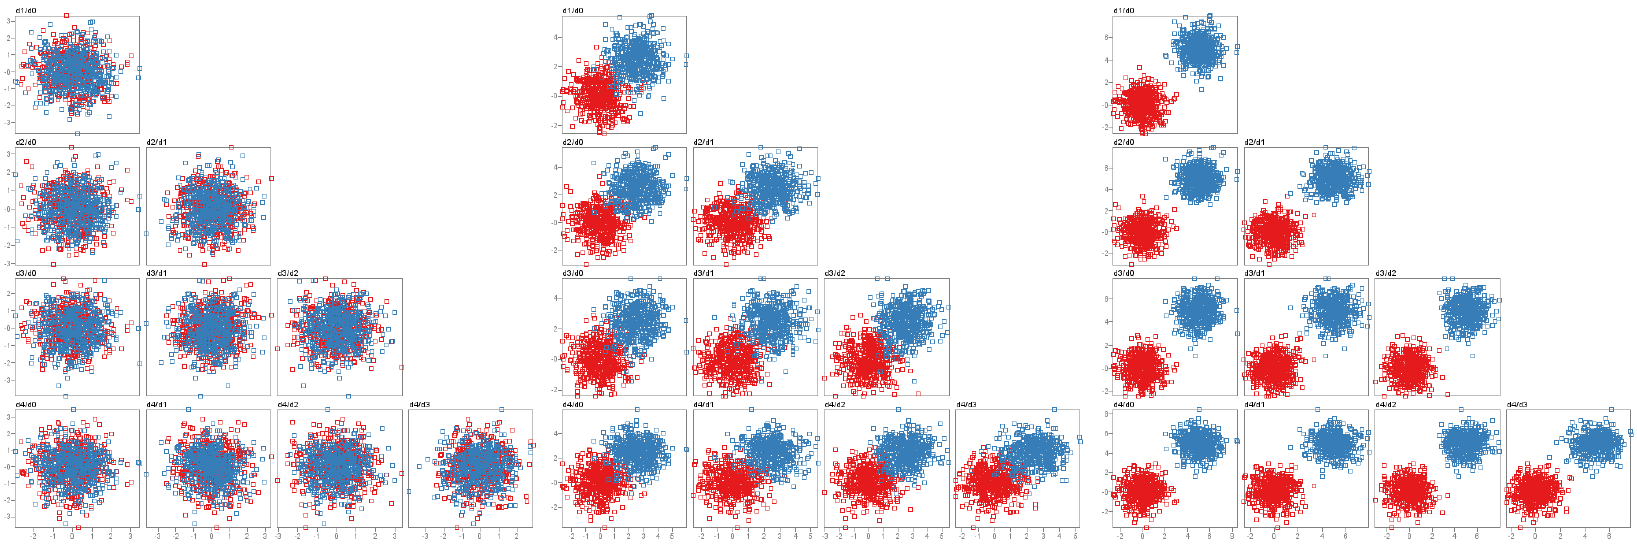
Class separation is an important concept in machine learning and visual analytics. We address the visual analysis of class separation measures for both high-dimensional data and its corresponding projections into 2D through dimensionality reduction (DR) methods. Although a plethora of separation measures have been proposed, it is difficult to compare class separation between multiple datasets with different characteristics, multiple separation measures, and multiple DR methods. In this project, we are designing and developing interactive visualization approaches to support comparison between up to 20 class separation measures and up to 4 DR methods, with respect to any of 7 dataset characteristics: dataset size, dataset dimensions, class counts, class size variability, class size skewness, outlieriness, and real-world vs. synthetically generated data. ProSeCo supports (1) comparing across measures, (2) comparing high-dimensional to dimensionally-reduced 2D data across measures, (3) comparing between different DR methods across measures, (4) partitioning with respect to a dataset characteristic, (5) comparing partitions for a selected characteristic across measures, and (6) inspecting individual datasets in detail. We demonstrate the utility of our approaches with several usage scenarios, using datasets posted at our project page.
Papers and Datasets:
- ProSeCo: Visual analysis of class separation measures and dataset characteristics. Bernard, J., Hutter, M., Zeppelzauer, M., Sedlmair, M., Munzner, T. Computers & Graphics pp. 48-60, 2021
- SepEx: Visual Analysis of Class Separation Measures. Bernard, J., Hutter, M., Zeppelzauer, M., Sedlmair, M., Munzner, T. EuroVis Workshop on Visual Analytics (EuroVA), The Eurographics Association, 2020
- Datasets:100 Synthetic Datasets for the Analysis of Class Separation Measures. Bernard, J., Hutter, M., Zeppelzauer, M., Sedlmair, M., Munzner, T., 2020. Used in the SepEx and the ProSeCo publications